Project 3
The Client requested to perform a meta-analysis on the learning effect of Kahoot! game-based learning platform on adult students.
ACTIONS
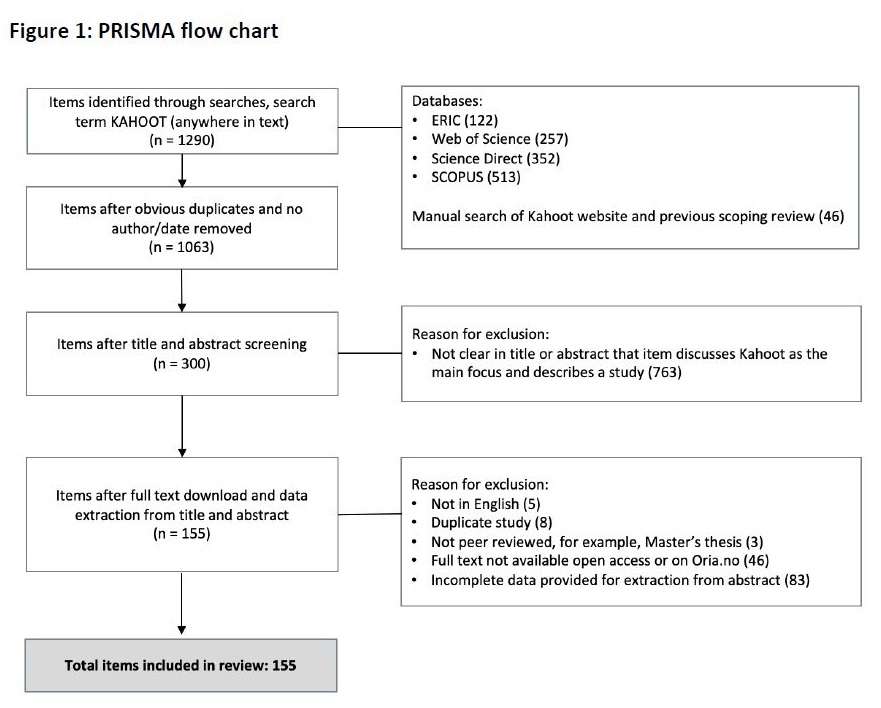
Firstly, a systematic literature review was conducted to identify eligible studies. Building on 155 varied empirical studies published across diverse media, a mixed-methods approach for synthesis was employed. Findings were summarised narratively, tabulated, and visually represented through graphs and in PRISMA diagram (below). Data tabulation and analysis were meticulously conducted in Word, Excel, and R.

In this project, there were multiple effect sizes per study. When studies contribute multiple effect sizes (e.g., different outcomes, subgroups, time points), a three-level model accounts for the non-independence of effect sizes within a study. Below, a piece of R code with a three-level modeling.
					library(metafor)
library(dmetar)
library(rlang)
library(ggplot2)

mydata <- read.csv(file.choose(), header=TRUE)
head(mydata)

# Fitting Three-Level Meta-Analysis Model
full.model <- rma.mv(yi = es,
                     V = var,
                     slab = author,
                     data = mydata,
                     random = ~ 1 | study.id/es.id,
                     test = "t",
                     method = "REML")
full.model
mlm.variance.distribution(full.model)

#Variance Distribution: The proportion of total variance attributed to each level of the model
level_variances <- summary(full.model)$sigma2
variance_proportions <- level_variances / sum(level_variances)
variance_proportions * 100  # Output as percentages
plot(variance_proportions)

#Fitting a simple random-effects model in which we assume that all effect sizes are independent (for comparison)
l3.removed <- rma.mv(yi = es,
                     V = var,
                     slab = author,
                     data = mydata,
                     random = ~ 1 | author/es.id,
                     test = "t",
                     method = "REML",
                     sigma2 =  c(0, NA))

summary(l3.removed)

#Comparing both models (two vs three-level model)
anova(full.model, l3.removed)


##################Fitting a CHE Model With Robust Variance Estimation
library(clubSandwich)
# constant sampling correlation assumption
rho <- 0.6
# constant sampling correlation working model
V <- with(mydata,
          impute_covariance_matrix(vi = var,
                                   cluster = author,
                                   r = rho))
che.model <- rma.mv(es ~ 1,
                    V = V,
                    random = ~ 1 | author/es.id,
                    data = mydata,
                    sparse = TRUE)
conf_int(che.model,
         vcov = "CR2")
coef_test(che.model,
          vcov = "CR2")

#Creating forest plots, Q-statistic for heterogeneity, I2 statistic.
library(metafor)

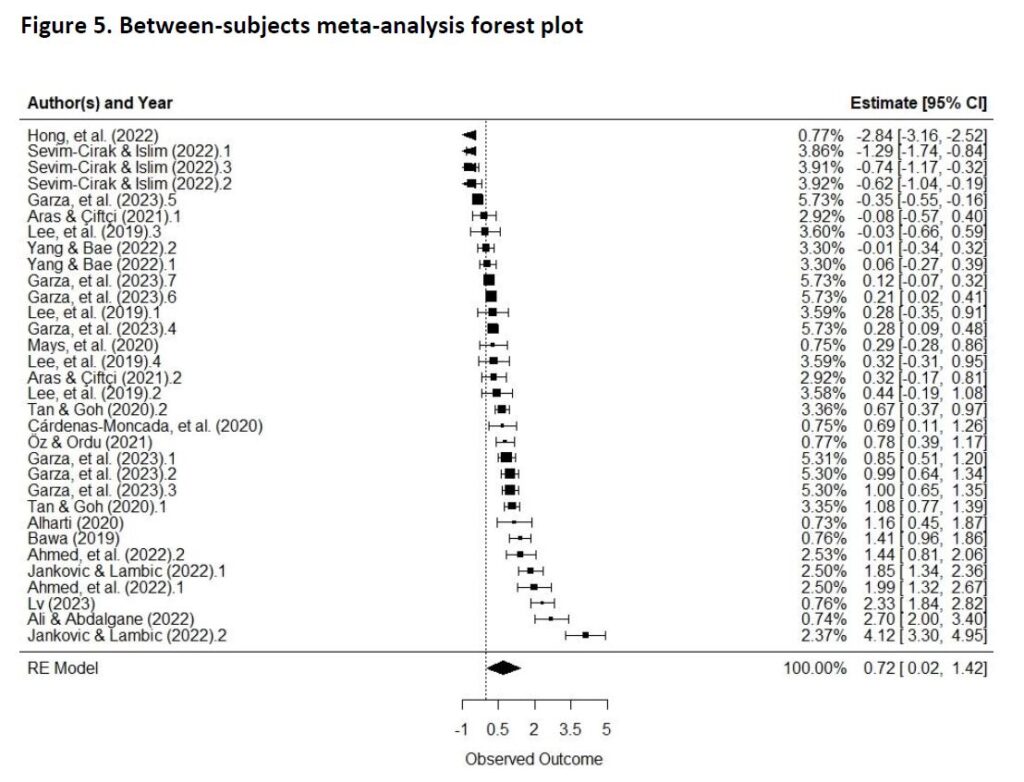
forest.rma(full.model, header = TRUE)
forest.rma(full.model, cex = 0.8, header = "Author(s) and Year", refline = 0, alim = c(-4,4), order = "obs", showweights = TRUE)
RESULTS
Summary: The estimated overall effect size is 0.72, with a standard error of 0.34 and a p-value of 0.043. The overall effect size is statistically significant, but the wide confidence interval (0.02 to 1.42) and significant heterogeneity among the studies (87%) suggests that more studies should be included to estimate the true effect size more precisely.

Sixteen eligible studies with a total of N = 2070 participants (1048 in experimental and 1022 in control groups) were included in the analysis. Between-group performance was assessed by the following measures: vocabulary and grammar scores, Vocabulary Levels Test (VLT), SGQ (Self-generated questioning), learning achievements, knowledge retention, skill performance, and subject exam scores.
The results of the meta-analysis of 32 effect sizes (K = 16 studies) revealed significant differences in true effect sizes across the investigated data (g = 0.72, 95% CI: 0.02-1.42, p = 0.043). This indicates a large and statistically significant positive effect of using Kahoot! Quiz games on student performance, meaning that students in experimental groups who used Kahoot! Quiz games performed significantly better than students in control groups who did not use Kahoot!.
					#Comparing both models (two vs three-level model)


        df      AIC      BIC     AICc   logLik     LRT   pval       QE
Full     3  91.3323  95.5359  92.2554 -42.6661                922.3021
Reduced  2 102.5973 105.3997 103.0418 -49.2987 13.2651 0.0003 922.3021

   Coef. Estimate    SE d.f. Lower 95% CI Upper 95% CI
 intrcpt    0.764 0.296 17.9        0.143         1.38
Comparison with 2-level model:
The Full (three-level) model exhibited a significantly better fit compared to the Reduced model with two levels. This was evidenced by lower Akaike Information Criterion (AIC) and Bayesian Information Criterion (BIC) values for the Full model, indicative of superior performance. Furthermore, the likelihood ratio test (LRT) comparing both models yielded a significant result (χ21[<=] 13.27, p = 0.0003), further supporting the improved fit of the Full model. While the Full model introduces an additional parameter, increasing the degrees of freedom from 2 to 3, this added complexity appears justified. Modelling the nested data structure within the Full model led to a more accurate estimate of the pooled effect.

Contact Details
- Email: contact@martacies.com
- Sheffield, United Kingdom